Visualise SP2010 Rest Data With Google Visualization API
This post is over a year old, some of this information may be out of date.
Some time ago I was testing out the Google Visualization API with SharePoint 2010 Rest functionality. The Google Visualization API is very handy if you want to visualize your data.
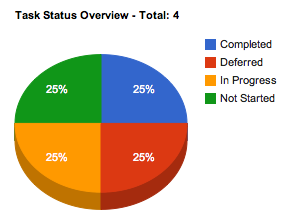
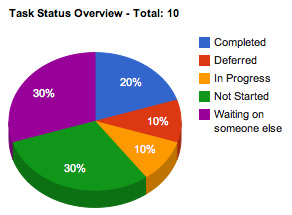
My intention was to create a pie chart to visualise the task statuses. The data was consumed from the SharePoint 2010 REST service with the help of jQuery.
With jQuery it is very simple to retrieve the results from the REST service. All you need to do is to create a call to the URL of the REST service with the getJSON method.
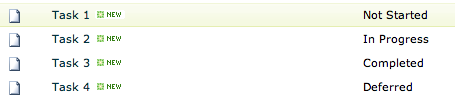
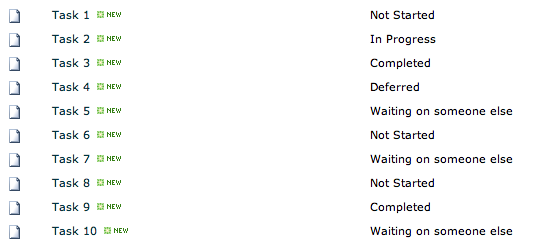
$.getJSON(url, function(data))The URL to the REST service is the following: http://YOUR SITE/_vti_bin/ListData.svc. In my case the full url to the task list is: http://your site/_vti_bin/ListData.svc/Tasks?$orderby=Status asc. As you can see it will retrieve all my tasks and order them by the status value. This result can than be used to create a pie chart.
On the Google Visualization site I did a quick search for a pie chart. Google shows you an example of the pie chart and the corresponding code.
Here is my code, feel free to make some code optimisation.
<script src="jquery.min.js" type="text/javascript"></script>
<script type="text/javascript" src="jsapi"></script>
<script language="javascript" type="text/javascript"> google.load("visualization", "1", {packages:["corechart"]}); google.setOnLoadCallback(drawChart);
function drawChart() { //Get the Rest url var url = "http://YOUR SITE/_vti_bin/ListData.svc/Tasks?$orderby=Status asc";
//Request json data $.getJSON(url, function(data){ //Prepare Google data var googleData = new google.visualization.DataTable(); googleData.addColumn('string', 'Task Status'); googleData.addColumn('number', 'Total');
var check = 0; var checkStatus = ""; //Store the statuses and total values var clientData = []; var total; var checkTotal = 0;
//Get the number of results checkTotal = data.d.results.length; $.each(data.d.results, function (i, result) { total = i; //Check if first item if(i === 0) { checkStatus = result.StatusValue; check = 1; } else { if(checkStatus != result.StatusValue) { clientData.push( { Status: checkStatus, Total: check } );
checkStatus = result.StatusValue; check = 1; } else { check++; } //Check if it is the last item if(total === (checkTotal - 1)) { clientData.push( { Status: checkStatus, Total: check } ); } } }); googleData.addRows(checkTotal); var i = 0; for (x in clientData) { //Add value to Status googleData.setValue(i, 0, clientData[x].Status); //Add value to Status total googleData.setValue(i, 1, clientData[x].Total); i++; }
var chart = new google.visualization.PieChart(document.getElementById('chart_div')); chart.draw(googleData, {width: 450, height: 300, title: 'Task Status Overview - Total: ' + checkTotal, is3D: true}); }); }</script>
<div id="chart_div"></div>You can place this code in a HTML Form Web Part. The end result will be the following.
Related articles
Data View Web Part: Create a Google Chart With XSLT
How to Define a Custom Group Display Template (GroupTemplateId) for the Search Results WebPart via JavaScript
How to use the Search Results WebPart as Replacement When Content Search WebPart is not available in Your Farm
Report issues or make changes on GitHub
Found a typo or issue in this article? Visit the GitHub repository to make changes or submit a bug report.
Comments

Let's build together
Manage content in VS Code
Present from VS Code
Engage with your audience throughout the event lifecycle